Never wonder why your Mac is slow again.
MoniMac is a free system monitor for macOS. It keeps CPU, memory, GPU, network and temperature one glance away in your menu bar — and tells you the moment an app starts dragging your Mac down.
Native for Apple silicon · macOS 14.2 or later · Under 10 MB
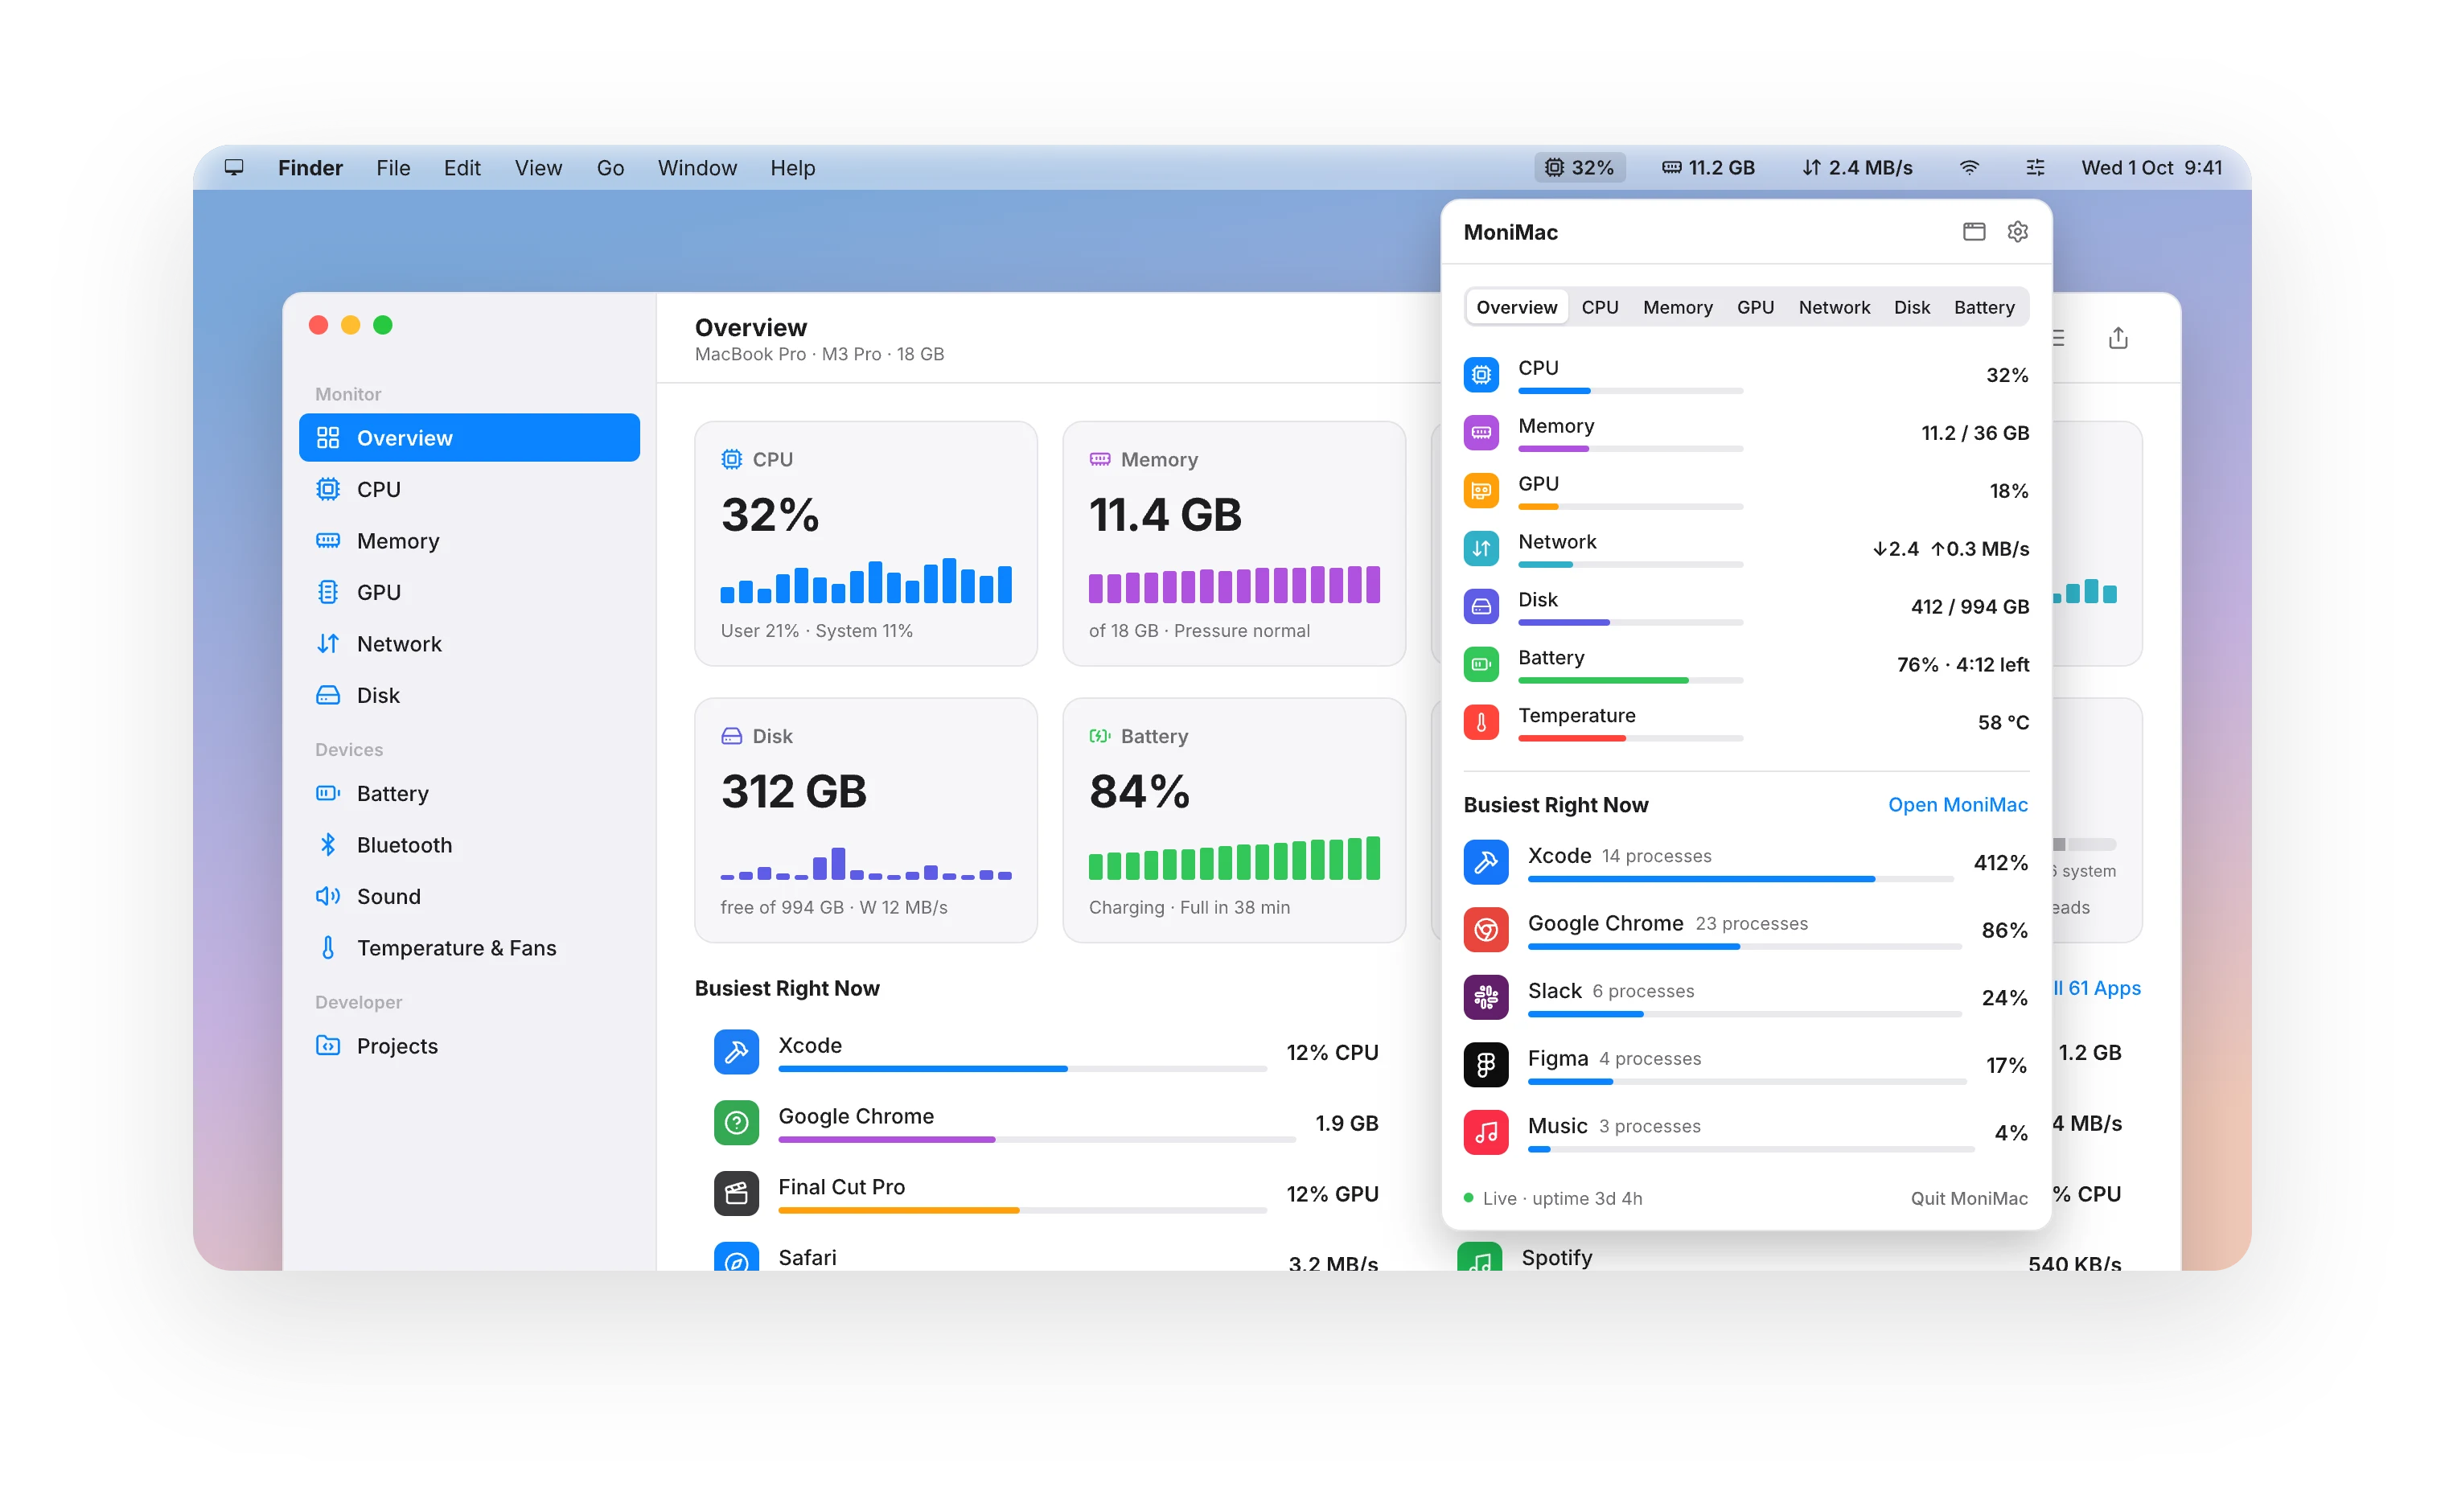
In the menu bar
Every metric gets its own place in the menu bar.
CPU, memory, network, GPU and temperature can each live up there on their own. Keep the ones you care about, in the style that suits you, and leave the rest out.
Three ways to read it
Value only for compact numbers. Graph only for a 60‑second sparkline. Or value and graph together when you want both.
Speaks up under strain
When a metric runs hot, its item turns into a warning sign. Hover for the cause, click to find the app behind it.
Arrange it like any menu extra
Hold ⌘ and drag to reorder. Drag an item off the bar to hide it.
Value onlyCompact numbers, monospaced feel
Graph onlyLast 60 seconds as a sparkline
Value + graphMost information, most width
Warning stateUnder system strain, the item becomes a warning sign
ReorderItems move like any system menu extra
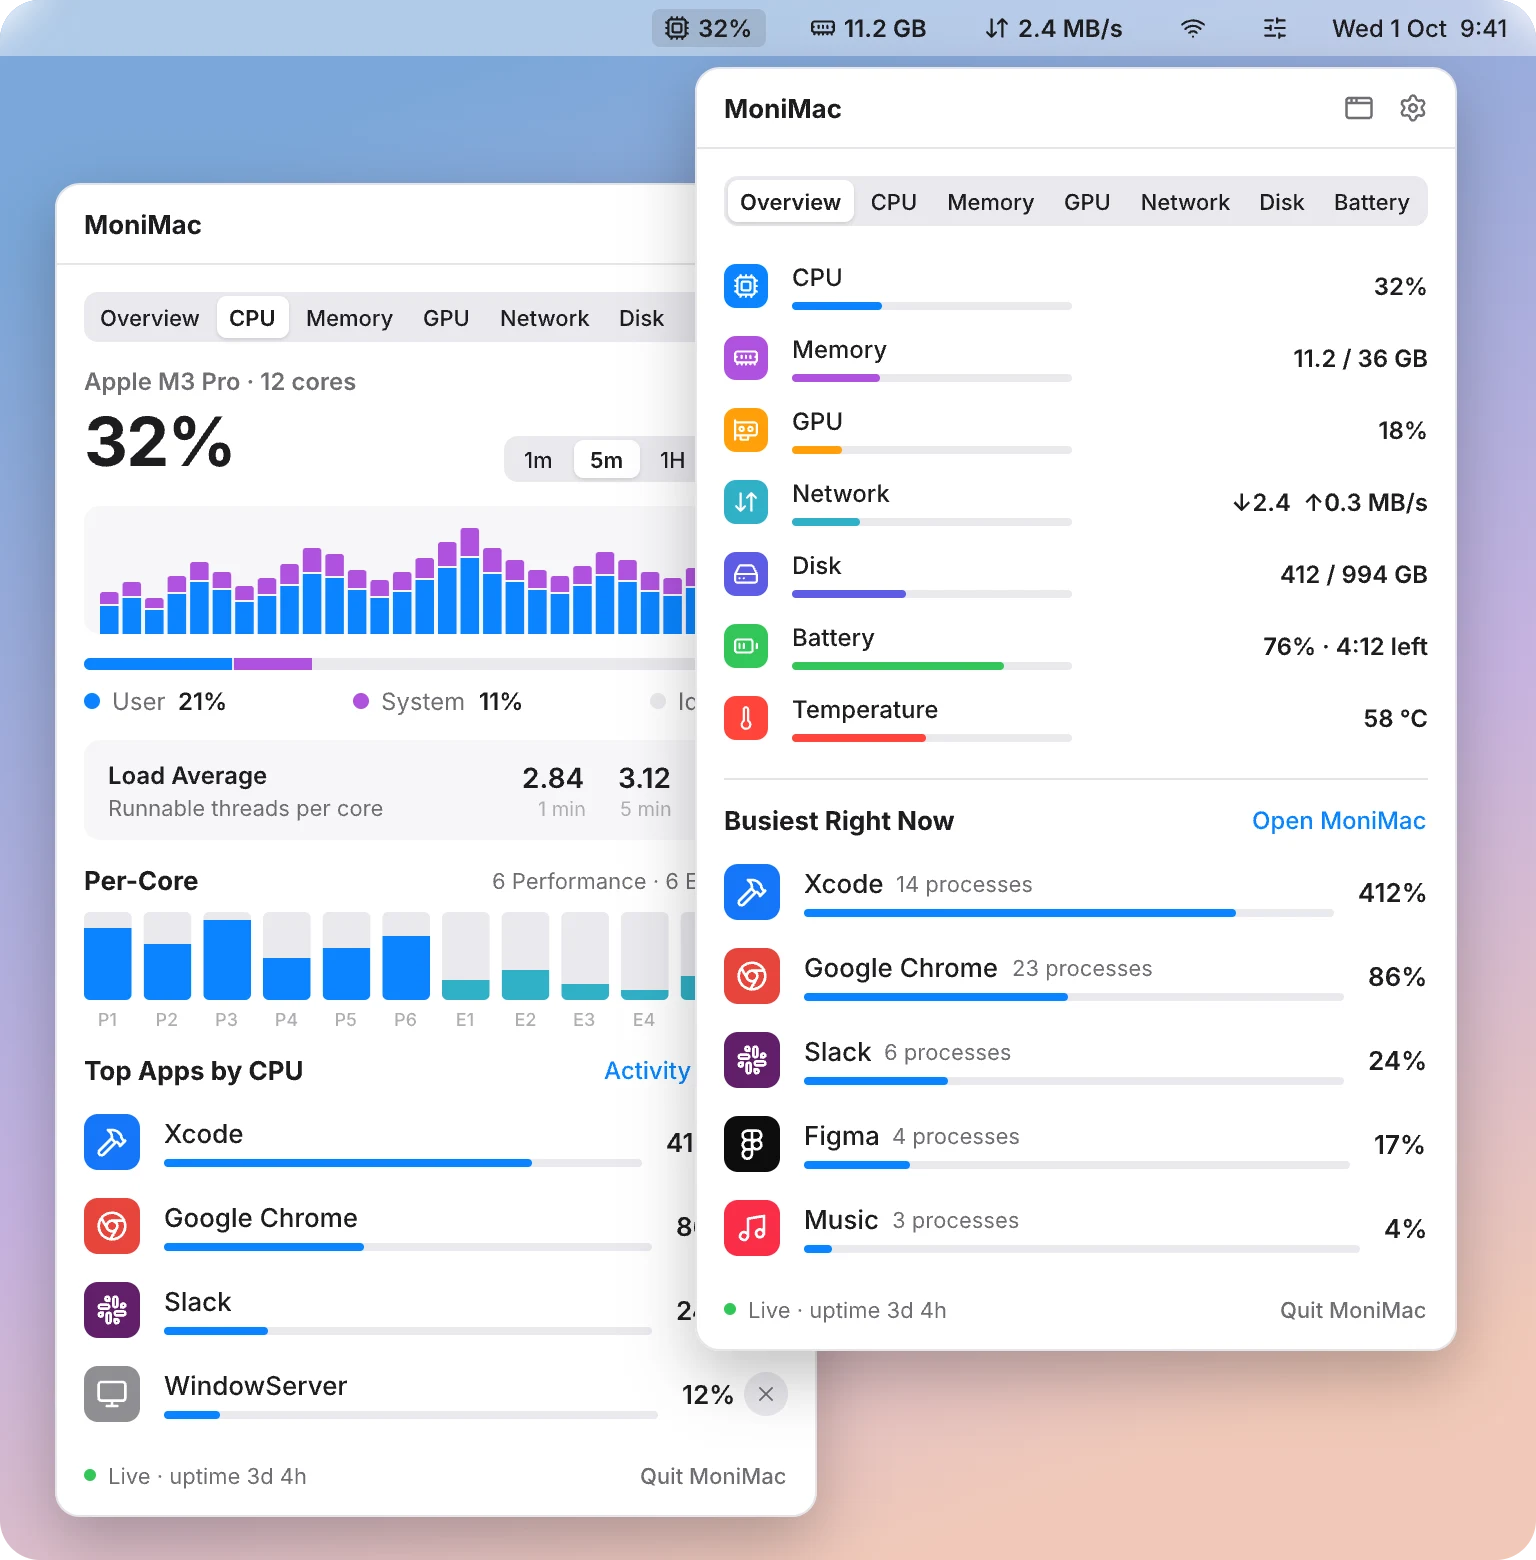
One click, the whole picture
Click any MoniMac item and a popover opens with every metric at once, plus the apps working hardest right now.
Drill in without leaving
Tabs take you straight to CPU, memory, GPU, network, disk and battery, with live history, per‑core load and the top apps.
SYSTEM METRICS
Everything about your Mac.
One window.
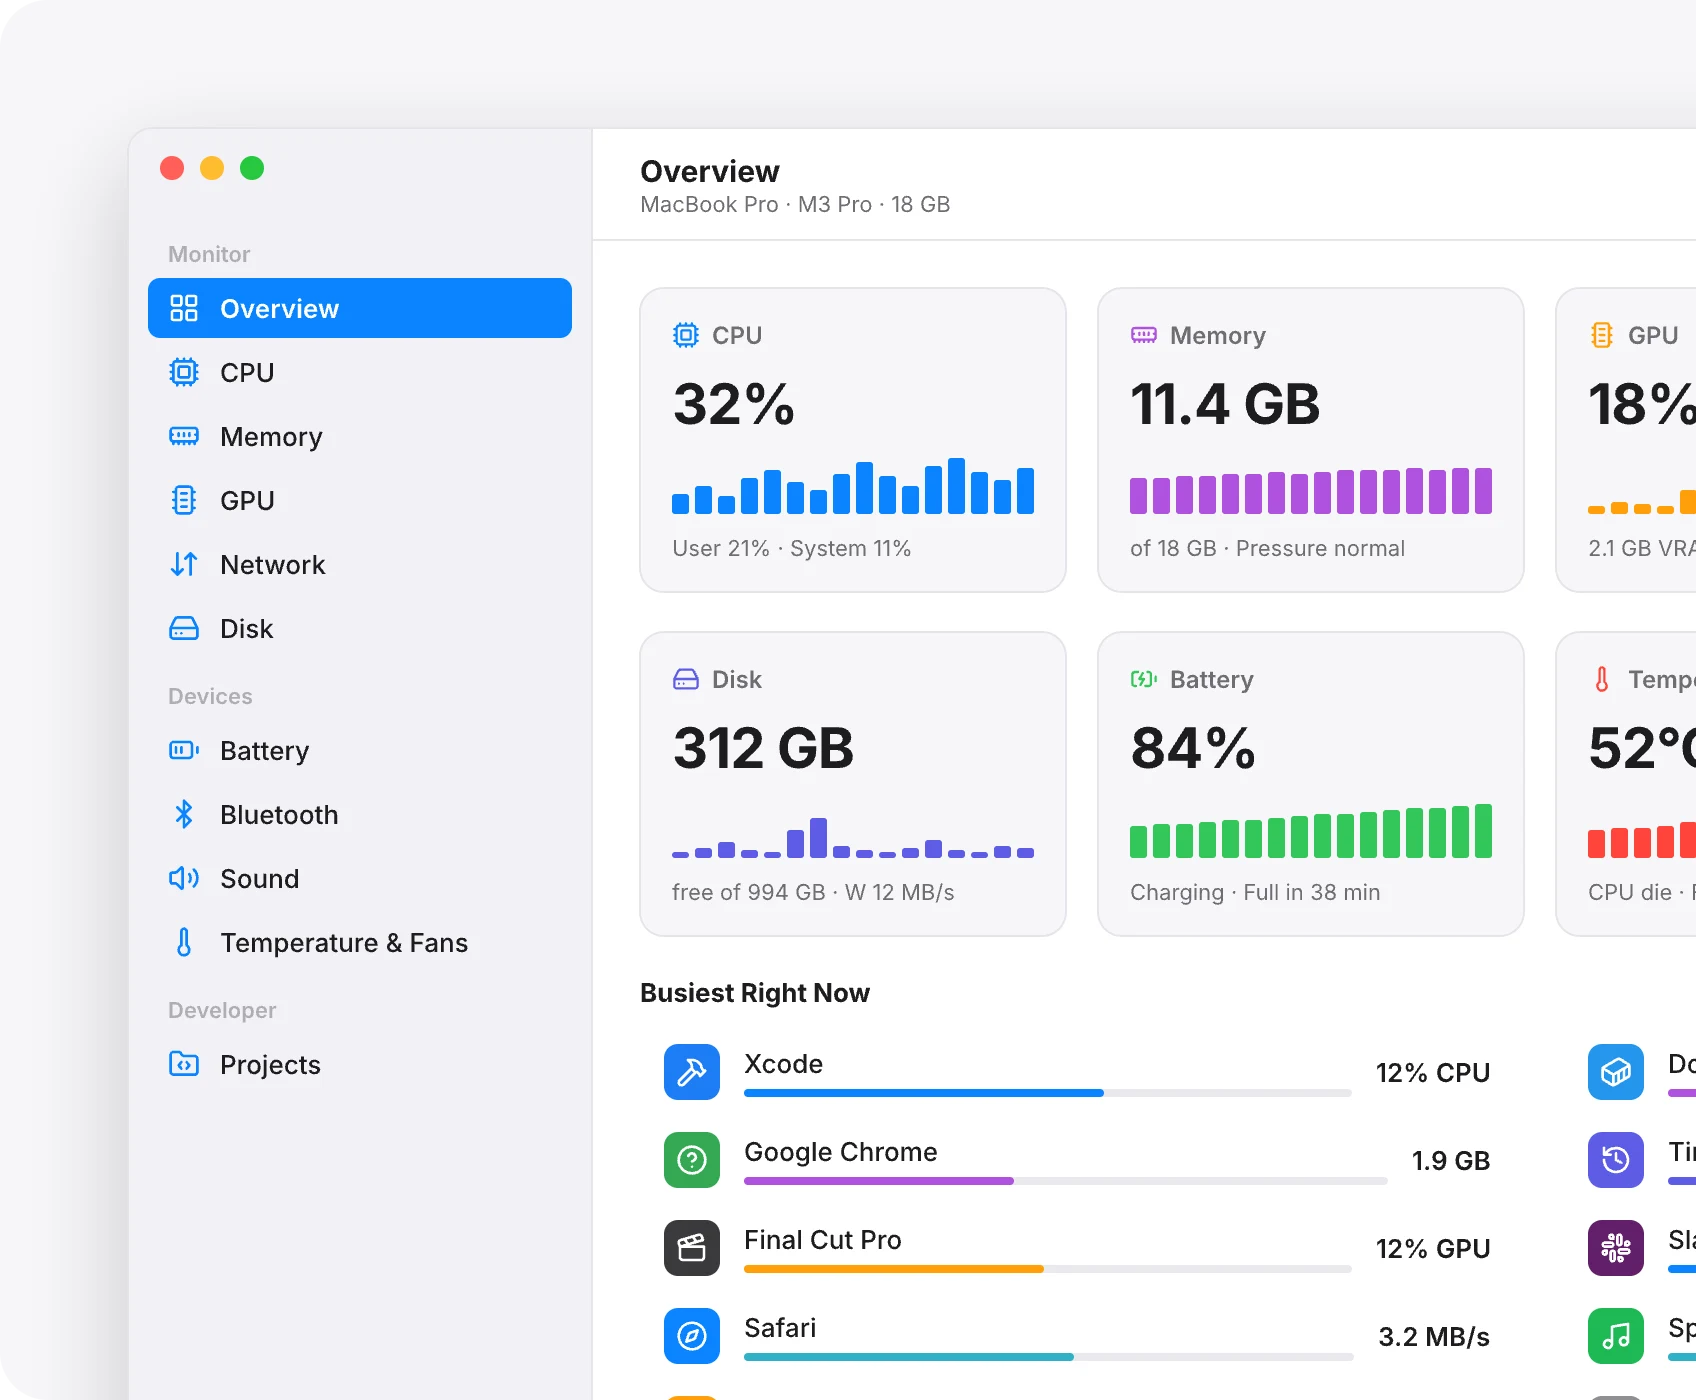
CPU, memory, GPU, network and disk, down to the app using them. Live numbers at a glance, with 30 days of history behind every one.
CPU
Per-core load across P and E cores, plus 1, 5 and 15-minute load average.
Memory
Pressure, swap and compression, so you know when it’s actually tight.
GPU
Utilization, and which apps are leaning on it.
Network
Live throughput up and down, plus 7 and 30-day totals.
Disk
Read and write speeds, a storage breakdown and SSD health.
Every app
CPU, memory, GPU, network, disk and power for each app.
30 days of history, kept on your Mac.
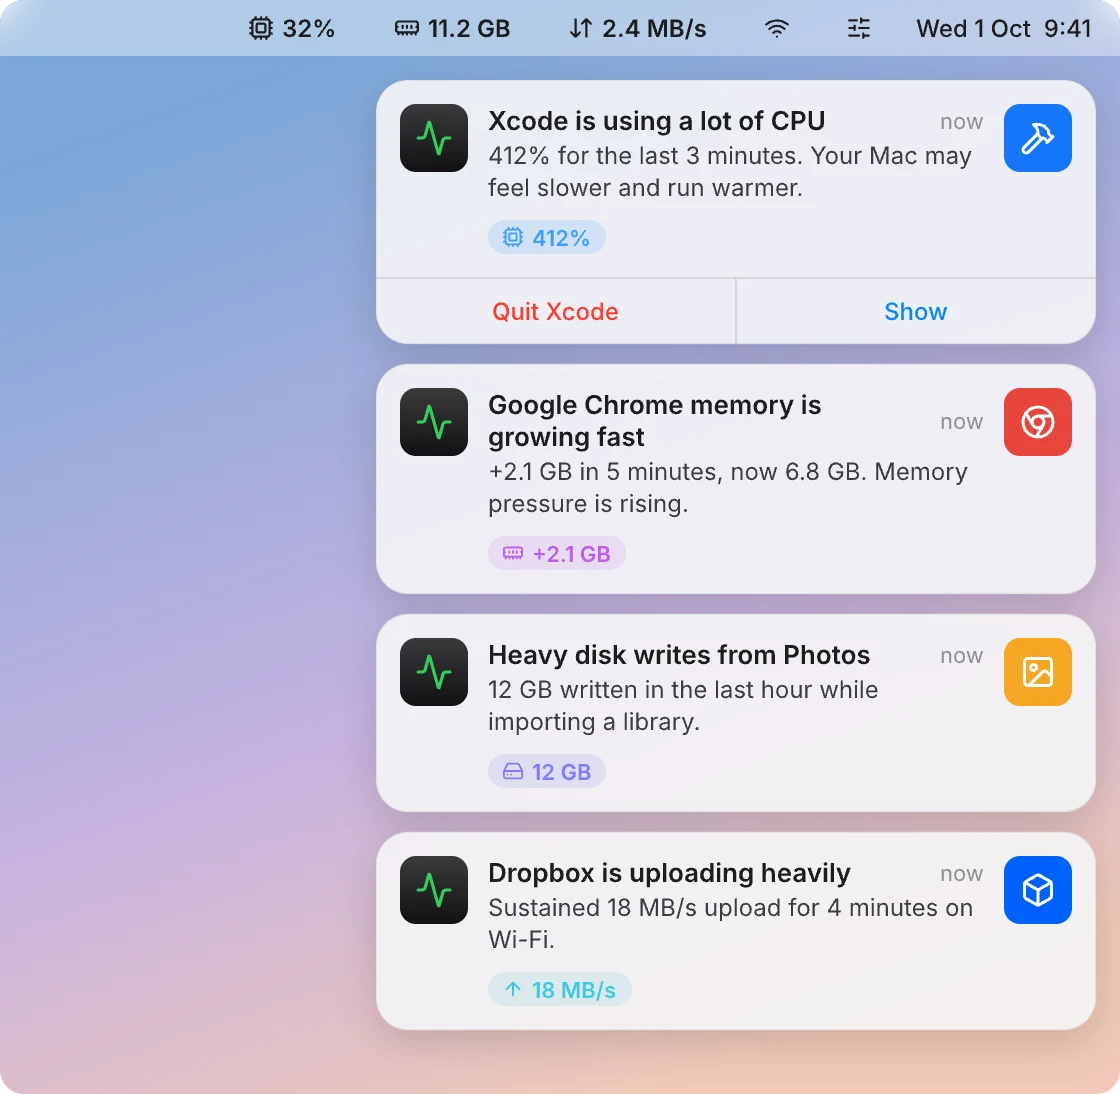
Smart Alerts
Hear from your Mac before it slows down.
MoniMac watches quietly in the menu bar and only speaks up when something is actually wrong — and when it does, the fix is one click away.
01 Notice
Four signals, measured over time — not spikes.
A single busy second isn't a problem. MoniMac waits until a pattern holds, so the alerts you get are the ones worth reading.
- CPUOne app stays above your threshold for 2 minutes
- MemoryAn app grows fast — +1 GB in 10 minutes may be a leak
- DiskSustained heavy writes to your drive
- NetworkHeavy uploads running in the background
02 Act
Quit the app — and everything it left running.
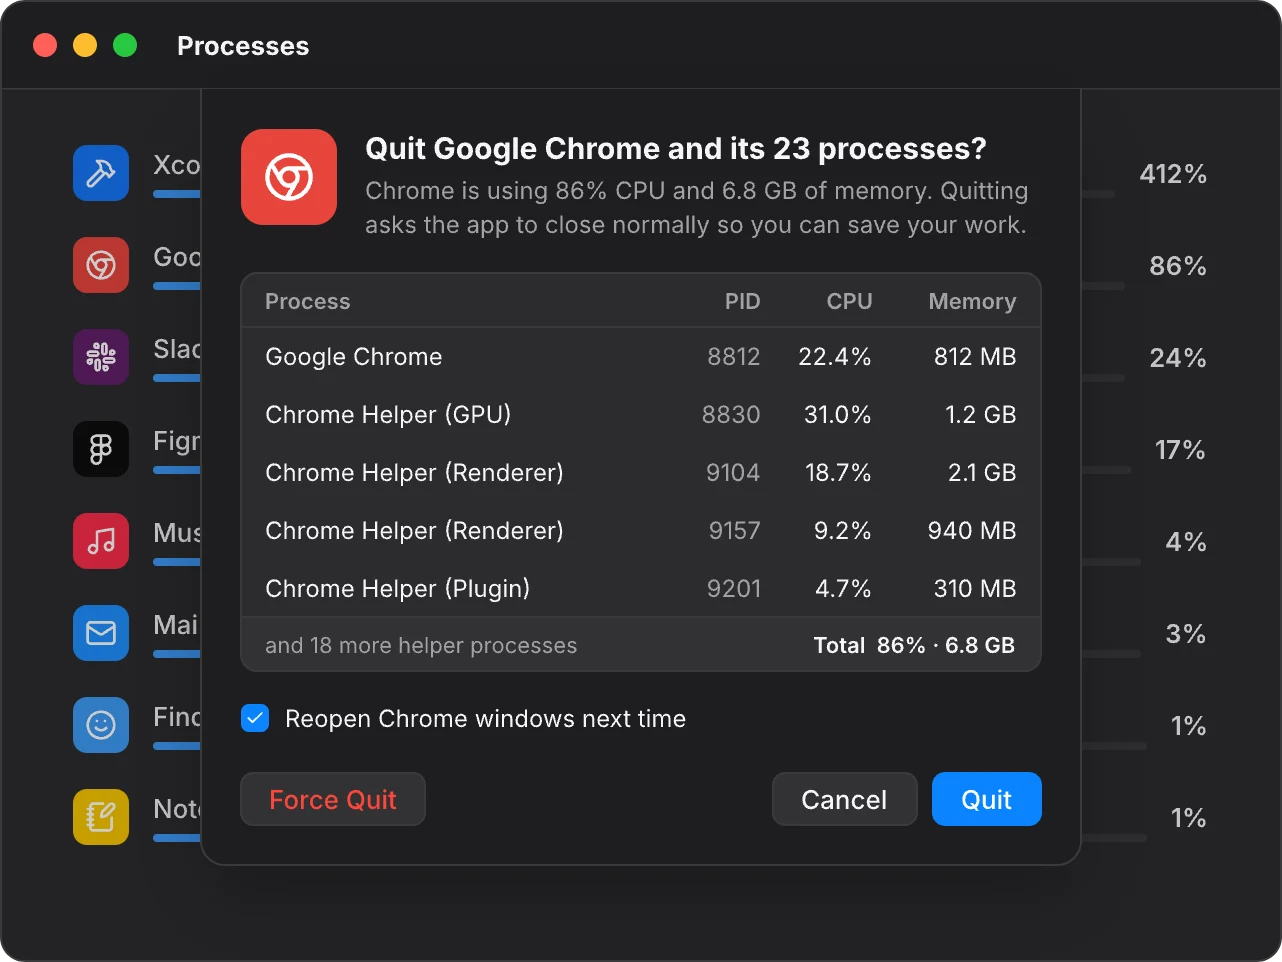
Act right from the notification. Before anything closes, a confirmation sheet lists the app and every helper process, with the CPU and memory each one is using.
- Helpers are included, so nothing lingers
- See exactly what will close, and what it frees
- Asks apps to quit normally so you can save
Devices & Developer
Everything around your Mac. And everything running on it.
MoniMac goes past CPU and memory. It watches your battery's health, the AirPods in your ears, every app's volume and the fans you never hear — then goes one step further for developers.
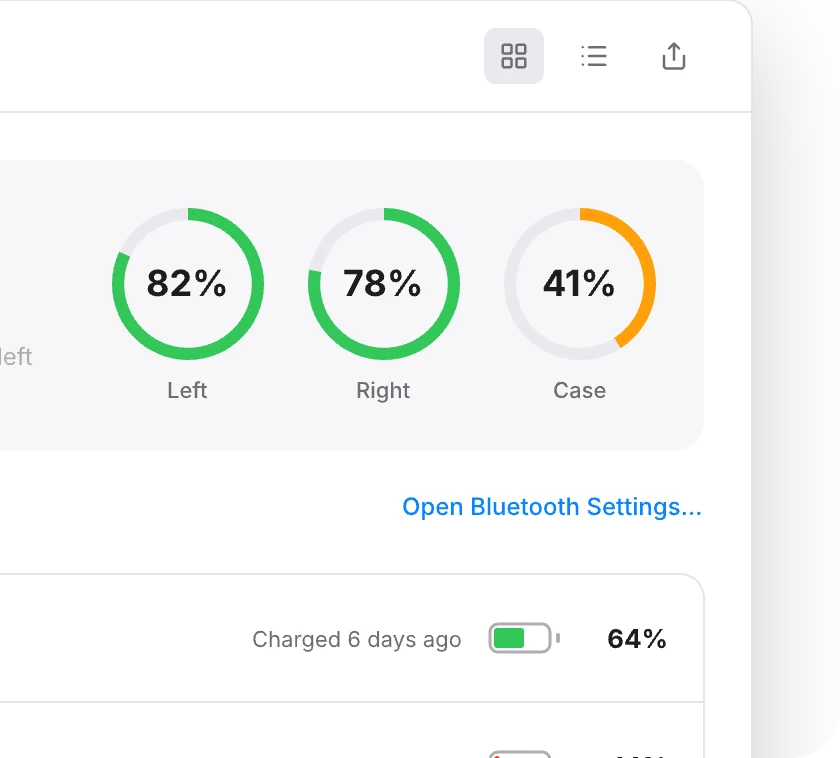
Bluetooth
AirPods left, right and case, keyboard, trackpad and mouse. A heads-up before anything dies.
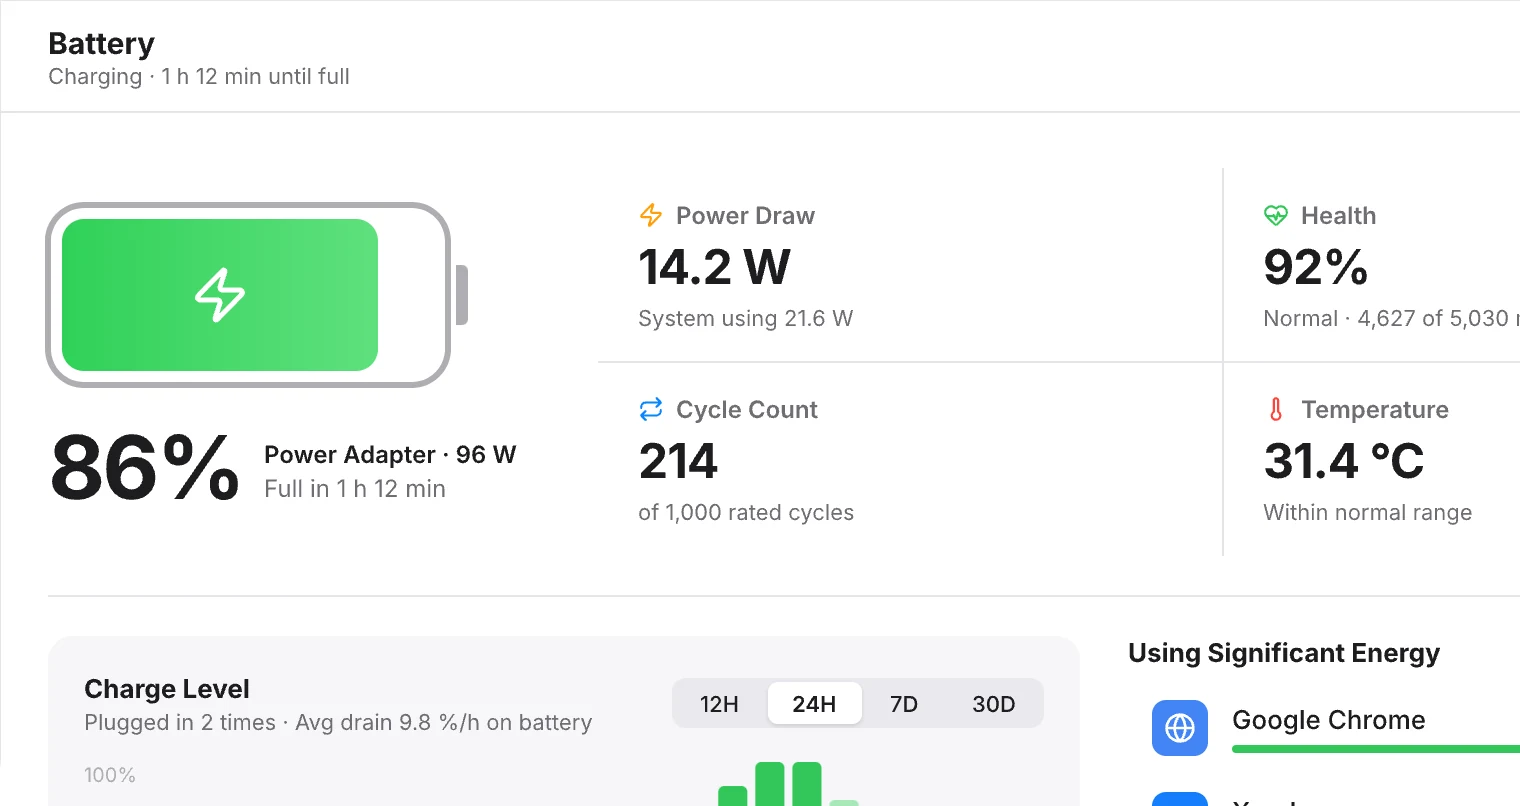
Battery
Charge, health, cycle count and live power draw — plus which apps are draining it.
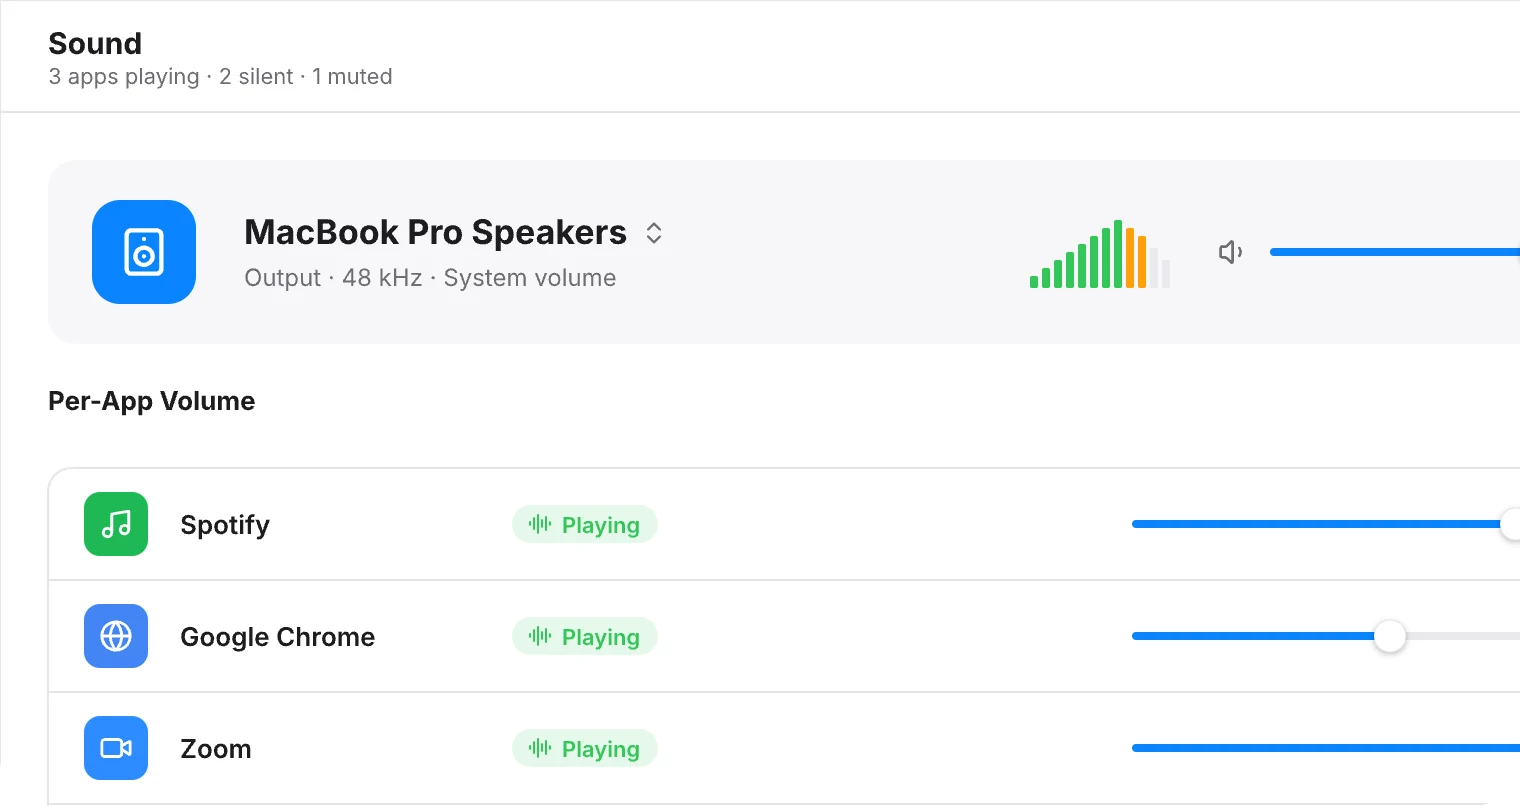
Sound
Set the volume of each app on its own, and mute the one that keeps chiming.
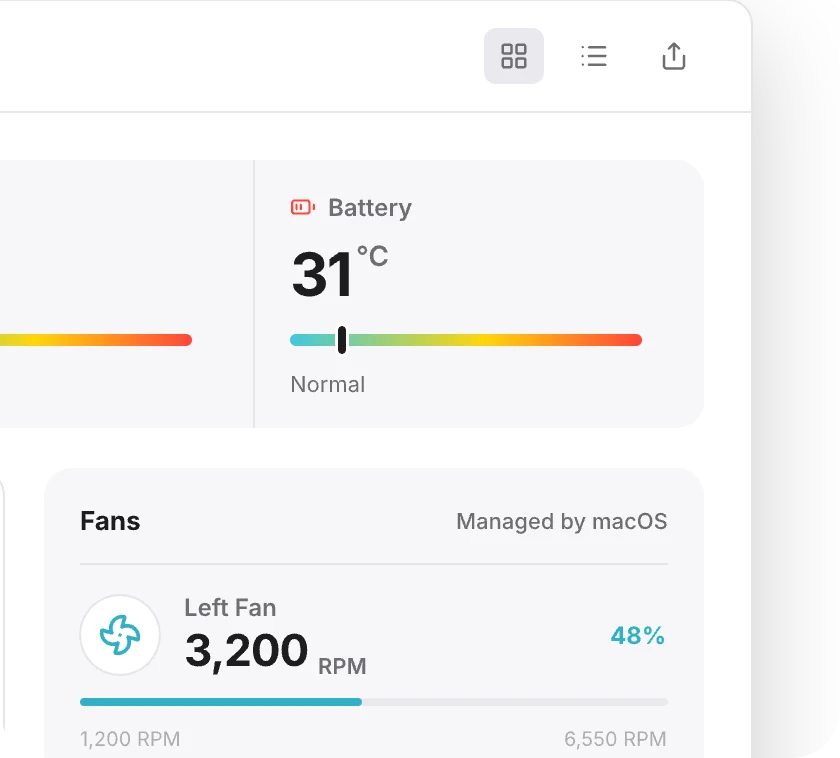
Temperature & Fans
Sensor temperatures and fan speeds, read-only — so you know why it's warm without touching a thing.
For developers · Projects
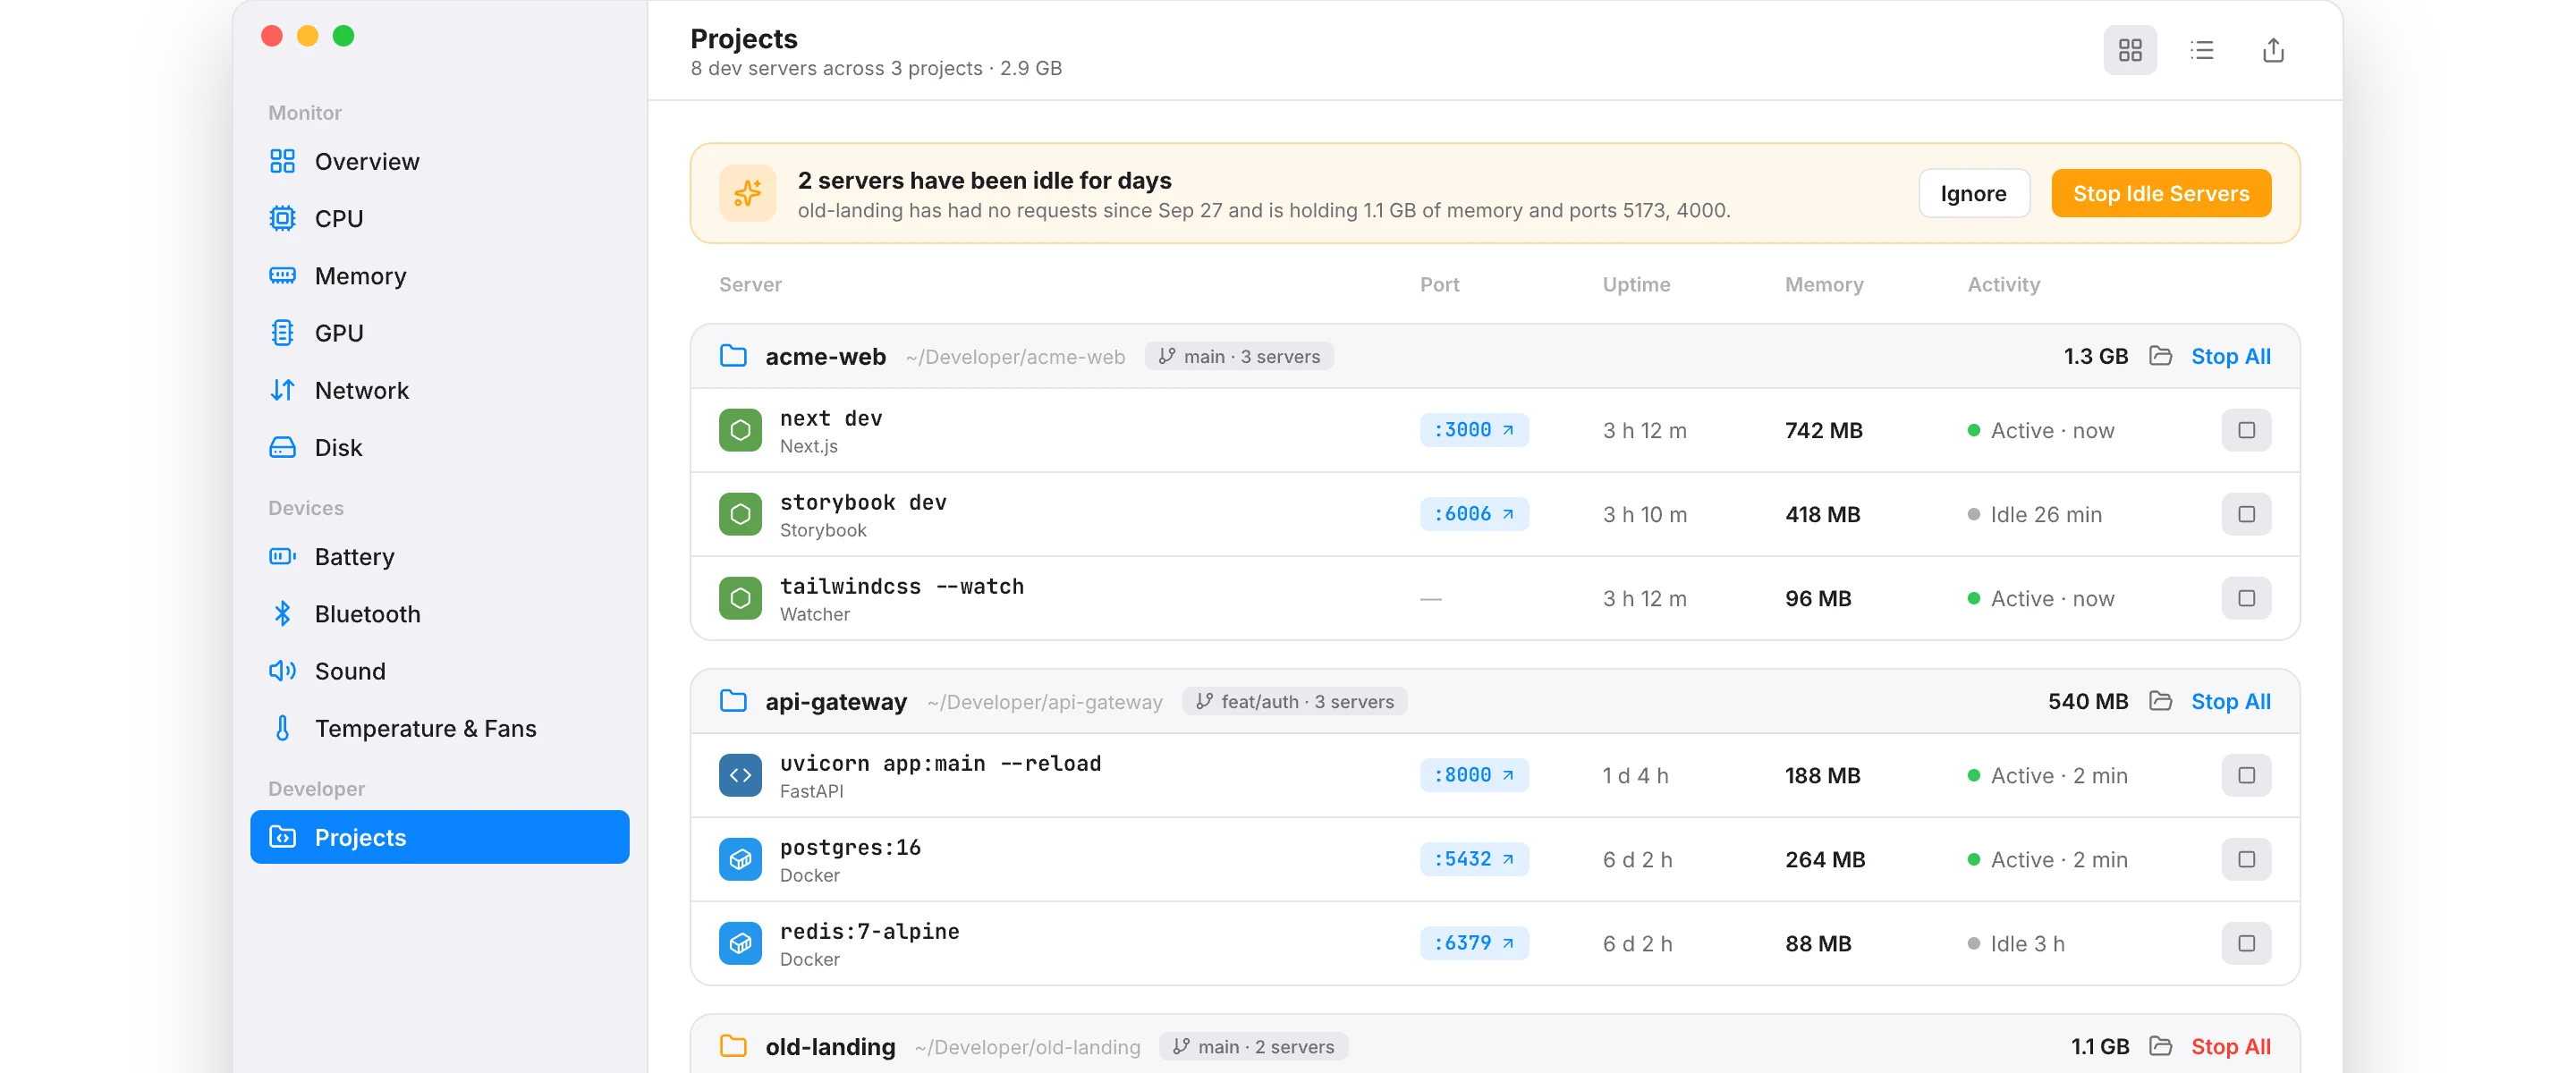
That dev server from last week? Still running.
Projects finds every local dev server, groups them by repo, and shows port, uptime and memory side by side. Servers idle for days get flagged — stop them in one click.
- Next.js
- Vite
- Docker
- FastAPI
- and more
FAQ
Questions, answered.
What MoniMac does, what it costs, and how it compares with the system monitors you may already know.
What is MoniMac?
MoniMac is a free, open-source system monitor for macOS. It puts CPU, memory, GPU, network and temperature in your menu bar, and its popover and window add disk, battery, Bluetooth devices and sound, show which apps use the most CPU, memory, GPU, network, disk and power, and keep up to 90 days of history.
Is MoniMac really free?
Yes. MoniMac is free and open source, with no paid tier, subscription, account or license key. The source code is on GitHub.
How is MoniMac different from Activity Monitor?
Activity Monitor shows what is running right now. MoniMac keeps the numbers in your menu bar, groups helper processes under the app they belong to, keeps up to 90 days of history, shows temperatures and fan speeds, and alerts you when an app keeps using too much CPU, memory, disk or network.
Is MoniMac an alternative to iStat Menus or Stats?
Yes. Like iStat Menus and Stats, MoniMac shows CPU, memory, GPU, network and temperature in the macOS menu bar, with disk, battery and Bluetooth devices in its window. iStat Menus is paid; MoniMac is free and open source. MoniMac also alerts you when an app keeps using too much, sets the volume of each app, and finds local dev servers you forgot to stop.
How do I check CPU temperature and fan speed on a Mac?
macOS has no built-in view for sensor temperatures. MoniMac reads them from the System Management Controller and shows CPU, GPU and other sensor temperatures and fan speeds in its Temperature & Fans tab, and can show a temperature in the menu bar. It only reads them: MoniMac never changes fan speeds and needs no admin password.
How do I find out why my Mac is slow?
Open MoniMac’s popover or window to see which apps are using the most CPU, memory, GPU, disk and network right now, and look at the history to see when it started. Alerts tell you when an app stays busy for minutes or its memory grows fast, and you can quit the app, with its helper processes, right from the list.
Does MoniMac slow down my Mac?
No. MoniMac is a native Swift app under 10 MB, built to use less than 1% CPU on average with the popover closed. Each reading is refreshed only as often as it changes.
Which Macs does MoniMac support?
MoniMac runs on Macs with Apple silicon (M1 or later) and needs macOS 14.2 or later. Intel Macs aren’t supported.
Does MoniMac collect my data?
No. MoniMac has no analytics, tracking or account. Its history is a database on your Mac, and the only connection it makes itself is checking GitHub for updates.
How do I install MoniMac?
Download the disk image, drag MoniMac into Applications, and run “xattr -dr com.apple.quarantine /Applications/MoniMac.app” in Terminal once. MoniMac isn’t notarized by Apple, so macOS blocks it until that flag is removed. Updates install from inside the app.